
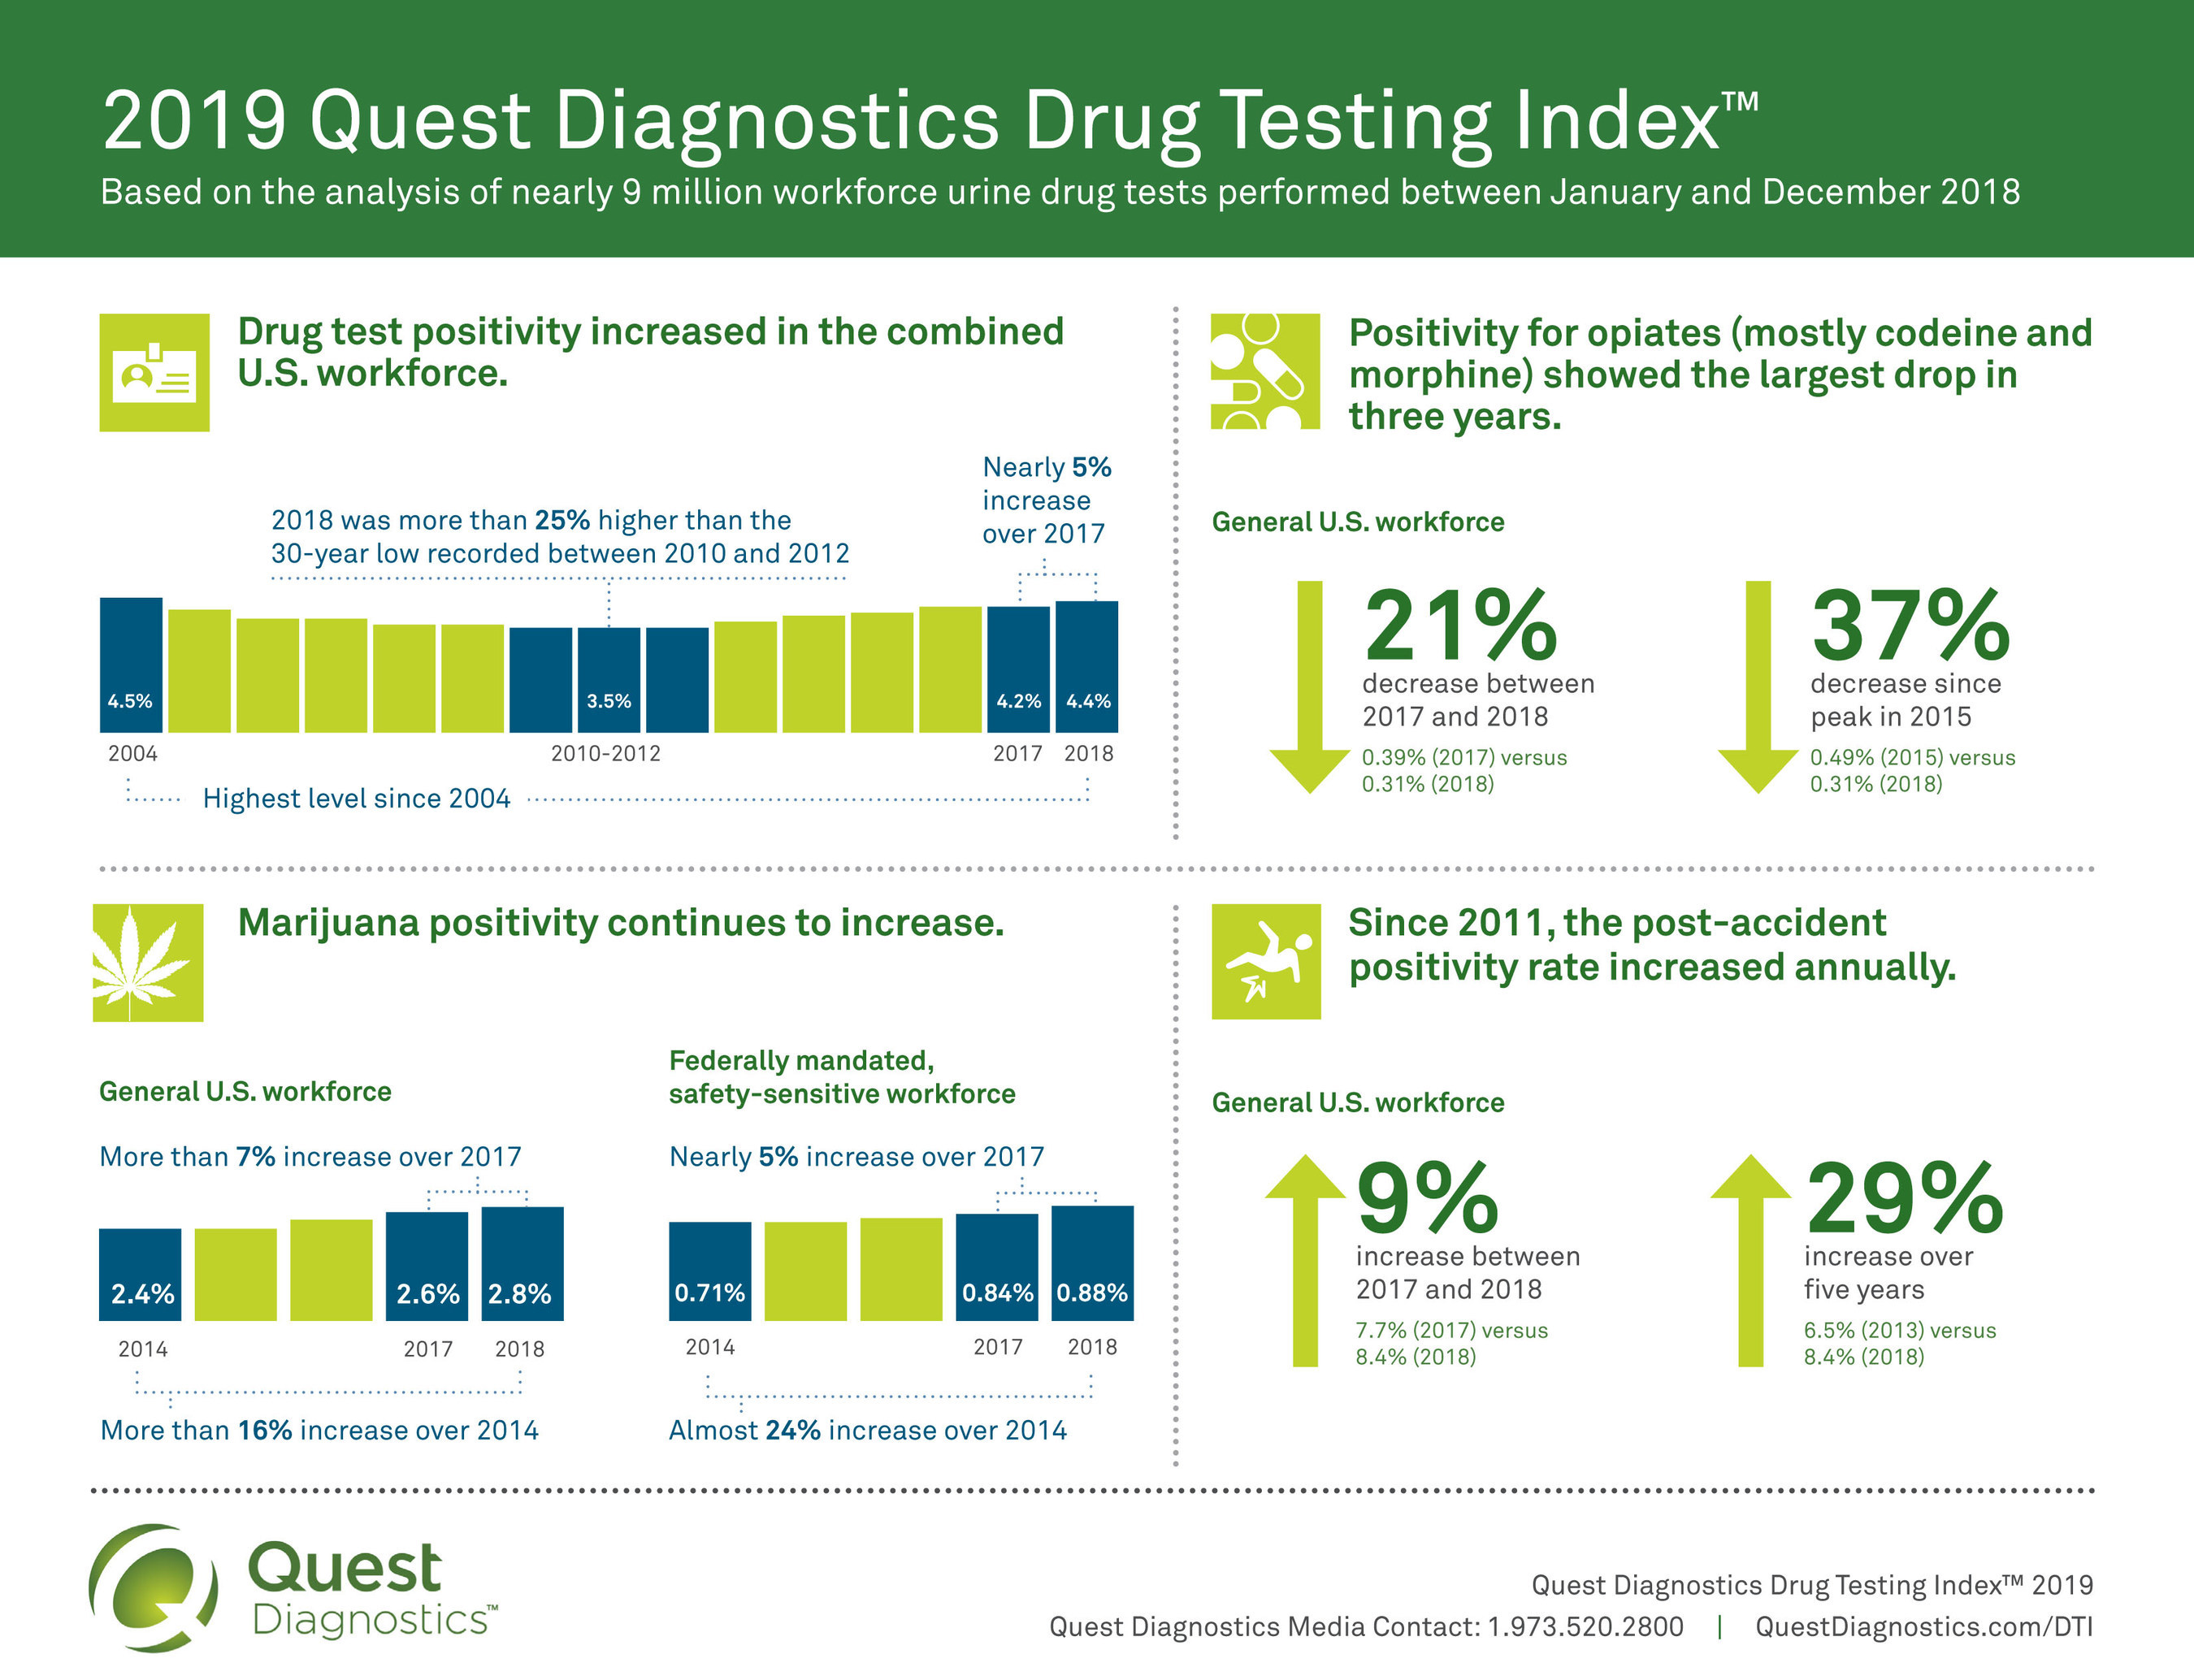
SECAUCUS, N.J., April 11, 2019 /PRNewswire/ -- The rate of workforce drug positivity hit a fourteen-year high in 2018, according to a new analysis released today by Quest Diagnostics (NYSE: DGX), the world's leading provider of diagnostic information services. Positivity rates in the combined U.S. workforce increased nearly five percent in urine drug tests (4.2% in 2017 versus 4.4% in 2018), climbing to the highest level since 2004 (4.5%) and are now more than 25 percent higher than the thirty-year low of 3.5 percent recorded between 2010 and 2012.

The new findings of the Quest Diagnostics Drug Testing Index™ were unveiled today at the Drug and Alcohol Testing Industry Association (DATIA) annual conference in Chicago.
For an interactive map with positivity rates and trend lines by three-digit zip code in the United States, visit DTIDrugMap.com.
"Our in-depth analysis shows that marijuana is not only present in our workforce, but use continues to increase," said Barry Sample, PhD, senior director, science and technology, Quest Diagnostics. "As marijuana policy changes, and employers consider strategies to protect their employees, customers and general public, employers should weigh the risks that drug use, including marijuana, poses to their business."
Barry Sample, PhD, senior director of science & technology at Quest Diagnostics, and Kimberly Samano, PhD, scientific director at Quest Diagnostics will share the latest data and analysis from the Drug Testing Index via a live webcast on Tuesday, April 16, 2019 at 11 a.m. EDT. Click here to register and attend.
Marijuana dominates in general U.S. workforce; opiate positivity declines
Marijuana continues to top the list of the most commonly detected illicit substances across all workforce categories (general U.S. workforce; federally mandated, safety-sensitive workforce; and combined U.S. workforce, which includes the prior two populations) and specimen types (urine, oral fluid, and hair).
The rate of marijuana positivity increased in nearly all workforce categories. In the general U.S. workforce, marijuana positivity increased nearly eight percent in urine testing (2.6% in 2017 versus 2.8% in 2018) and almost 17 percent since 2014 (2.4%).For the federally mandated, safety-sensitive workforce, which utilizes only urine testing, marijuana positivity grew nearly five percent between 2017 (0.84%) and 2018 (0.88%) and nearly 24 percent since 2014 (0.71%).
In the general U.S. workforce, the positivity rate for opiates in urine drug testing declined across all opiate categories. Among the general workforce screening for opiates (mostly codeine and morphine), positivity declined nearly 21 percent between 2017 and 2018 (0.39% versus 0.31%), the largest drop in three years and nearly 37 percent decrease since the peak in 2015 (0.49%). Among the more specific tests for other prescription opiates, the positivity for the semi-synthetic opiates (hydrocodone and/or hydromorphone) declined two percent between 2017 and 2018 (0.51% vs. 0.50%) and 43 percent since the five-year high in 2014 (0.88%). Similarly, the positivity for oxycodones (oxycodone and/or oxymorphone) declined more than 29 percent between 2017 and 2018 (0.61% vs. 0.43%) and more than 46 percent since the five-year high in 2014 (0.80%).
Positivity rates for both heroin and cocaine declined in general and federally mandated safety-sensitive U.S. workforce testing
Urine drug test results for the general U.S. workforce for heroin, indicated by the presence of the 6-acetylmorphine (6-AM) metabolite, declined six percent (0.033% in 2017 versus 0.031% in 2018) and more than 16 percent since its peak in 2015 and 2016 (0.037%). Cocaine positivity declined nearly seven percent in urine and more than 19 percent in oral fluid testing, but increased slightly year-over-year (6.3%) in hair testing.
Both heroin and cocaine positivity in the federally mandated, safety-sensitive workforce showed large declines between 2017 and 2018. Heroin positivity declined nearly 32 percent between 2017 and 2018 (0.019% versus 0.013%), with a decrease of more than 43 percent since 2015 (0.023%). 2018 positivity for cocaine declined nearly ten percent compared with 2017 (0.31% versus 0.28%), when the positivity rate was the highest in more than five years.
New Federal rules for opioid testing drive increase in safety-sensitive workforce positivity
Changes to Federal rules for drug testing the federally mandated, safety-sensitive workforce went into effect in January 2018. The addition of four semi-synthetic opiates contributed to the large increases in year-over-year positivity among those workers. In 2018, testing for semi-synthetic opiates (hydrocodone and/or hydromorphone) and for oxycodones (oxycodone and/or oxymorphone), the positivity rate was 0.45 percent and 0.34 percent, respectively. These positivity rates are both slightly less than general U.S. workforce testing.
Increases in post-accident positivity occur in both the federally mandated, safety-sensitive and, general U.S. workforce
In the federally mandated, safety-sensitive workforce, positivity for post-accident urine testing jumped more than 51 percent year-over-year (3.1% in 2017 versus 4.7% in 2018) and increased by nearly 81 percent between 2014 and 2018. The jump in 2018 was largely driven by the addition of prescription opiates to the panel where the post-accident positivity for the semi-synthetic opiates (hydrocodone and/or hydromorphone) and for oxycodones (oxycodone and/or oxymorphone) was 1.1 percent and 0.77 percent, respectively. Post-accident positivity in the general U.S. workforce climbed nine percent year-over-year (7.7% in 2017 versus 8.4% in 2018), and 29 percent over five years. The post-accident positivity rate has risen annually since 2011 in the general U.S. workforce and since 2010 in the federally mandated, safety-sensitive workforce.
"Increases in post-accident positivity among safety-sensitive workers should serve as a warning to employers that employee drug use may increase the risk of workforce accidents or injuries," said Kimberly Samano, PhD, scientific director, Quest Diagnostics. "Our analysis suggests that employers committed to creating a safe, drug-free work environment should incorporate strategies that monitor drug use above and beyond pre-employment drug screening."
Rise in urine specimens reported as invalid suggests more efforts to "cheat the test"
Findings show an increased percentage of urine specimens in both the federally mandated, safety-sensitive and general U.S. workforces reported as invalid due to inconsistency with normal human urine, suggesting attempts at specimen adulteration or substitution. Between 2017 and 2018, the percentage of invalid results in the federally mandated, safety-sensitive workforce jumped 80 percent (0.15% versus 0.27%), and 40 percent in the general U.S. workforce (0.15% versus 0.21%).
About the Quest Diagnostics Drug Testing Index™
The Quest Diagnostics Drug Testing Index™ (DTI) is a series of reports that provide insights into trends in workforce drug use, based on positivity results for de-identified laboratory testing performed by Quest Diagnostics for a range of illicit, legal and prescription drugs. It examines test results according to three categories of workers: federally mandated, safety-sensitive workers; the general workforce; and the combined U.S. workforce. Federally mandated, safety-sensitive workers include pilots, bus and truck drivers, and workers in nuclear power plants, for whom routine drug testing is mandated by the U.S. Department of Health and Human Services. Quest Diagnostics has analyzed annual workplace drug testing data since 1988.
The strengths of the DTI analysis include its large, nationally representative sample size, longitudinal monitoring, a testing population that is generally reflective of the U.S. workforce and the quality of the company's drug testing services to confirm positive results. Limitations include analysis only of employers that perform drug testing with the company, and a lack of exact cross-specimen comparisons due to variations in substances for which employers test. Quest Diagnostics has analyzed annual workplace drug testing data since 1988 and publishes the findings as a public service.
In addition to workplace drug testing, Quest is a leader in clinician-ordered drug testing services through its Prescription Drug Monitoring program to aid the detection of potentially dangerous forms of prescription and illicit drug use. For more information on Quest's prescription drug monitoring services, visit QuestDrugMonitoring.com
About Quest Diagnostics
Quest Diagnostics empowers people to take action to improve health outcomes. Derived from the world's largest database of clinical lab results, our diagnostic insights reveal new avenues to identify and treat disease, inspire healthy behaviors and improve health care management. Quest annually serves one in three adult Americans and half the physicians and hospitals in the United States. Our 46,000 employees understand that, in the right hands and with the right context, our diagnostic insights can inspire actions that transform lives. www.QuestDiagnostics.com.
![]()
SOURCE Quest Diagnostics
